library(tidyverse)
library(readxl)
library(lubridate)

path = "Excel/636 Repeat Customers in a Year.xlsx"
input = read_excel(path, range = "A2:C90")
test  = read_excel(path, range = "E2:G7")

repeat_customers = input %>%
  mutate(Year = year(Date)) %>%                                # Extract year from Date
  summarise(n = n(), .by = c(Year, Customer, Store)) %>%       # Count occurrences per Year, Customer, and Store
  filter(n > 1) %>%                                            # Keep only those with more than one occurrence
  summarise(
    Count = n_distinct(Customer),                             # Count unique customers
    Customers = paste0(unique(sort(Customer)), collapse = ", "), # Concatenate customer names
    .by = c(Year)                                             # Group by Year
  )

all.equal(repeat_customers, test)
#> [1] TRUEExcel BI - Excel Challenge 636
excel-challenges
excel-formulas
🔰 Find the unique repeat customers in a year. A repeat customer is that unique customer who does shopping in the same store more than once in the same…
Challenge Description
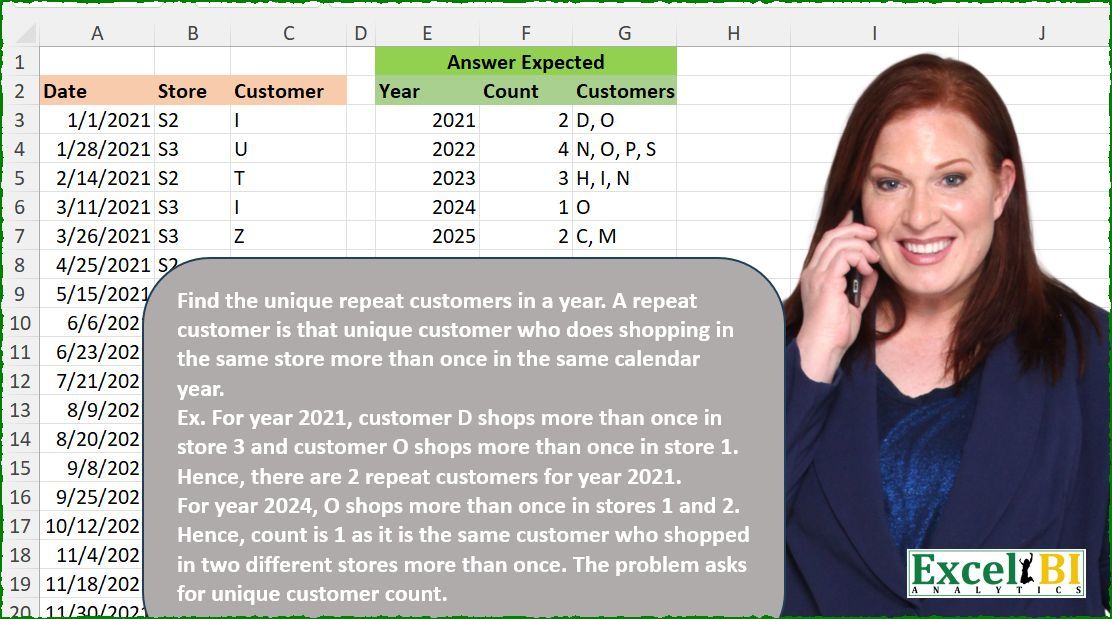
🔰 Find the unique repeat customers in a year. A repeat customer is that unique customer who does shopping in the same store more than once in the same calendar year. Ex. For year 2021, customer D shops more than once in store 3 and customer O shops more than once in store 1. Hence, there are 2 repeat customers for year 2021. For year 2024, O shops more than once in stores 1 and 2. Hence, count is 1 as it is the same customer who shopped in two different stores more than once. The problem asks for unique customer count.
🔗 Link to Excel file: 👉https://lnkd.in/dKPJcTqv
Solutions
Logic:
Extract the year from the
Datecolumn usinglubridate::year.Group by
Year,Customer, andStoreand count transactions.Filter groups where the count exceeds one to identify repeat customers.
Aggregate the results by year, counting unique customers and concatenating their names.
Strengths:
Compact and Readable: Makes excellent use of
tidyversefor grouping and summarizing.Dynamic Grouping: Handles year, customer, and store grouping effectively.
Areas for Improvement:
- None; the code is robust and handles edge cases well.
Gem:
- The use of
paste0(unique(sort(Customer)), collapse = ", ")ensures a clean and sorted list of customer names.
- The use of
import pandas as pd

path = "636 Repeat Customers in a Year.xlsx"
input = pd.read_excel(path, usecols="A:C", skiprows=1, nrows=88)
test = pd.read_excel(path, usecols="E:G", skiprows=1, nrows=5)

# Extract the year from the Date column
input['Year'] = pd.DatetimeIndex(input['Date']).year

# Group by Year, Customer, and Store and count occurrences
repeat_customers = (input.groupby(['Year', 'Customer', 'Store'])
                    .size()
                    .reset_index(name='n')   # Add a column 'n' for the counts
                    .query('n > 1')          # Filter rows where count > 1
                    .groupby('Year')         # Group by Year
                    .agg(
                        Count=('Customer', 'nunique'),  # Count unique customers
                        Customers=('Customer', lambda x: ', '.join(sorted(x.unique())))  # Concatenate customer names
                    )
                    .reset_index())

print(all(test == repeat_customers)) # TrueLogic:
Extract the year using
pd.DatetimeIndex.Group by
Year,Customer, andStore, and count transactions.Filter groups with more than one occurrence to identify repeat customers.
Aggregate by year to count unique customers and concatenate their names.
Strengths:
Efficient Grouping: Uses
groupbyandsizeto efficiently count occurrences.Dynamic Aggregation: The lambda function handles dynamic concatenation of sorted customer names.
Areas for Improvement:
- None; the solution is efficient and scalable.
Gem:
- The lambda function in
.aggis versatile and allows for clean customization of the output.
- The lambda function in
Difficulty Level
This task is moderate:
Requires grouping and aggregation across multiple dimensions.
Involves filtering and transforming data dynamically based on conditions.