library(tidyverse)
library(readxl)

path = "files/Ex-Challenge 05 2025.xlsx"
input = read_excel(path, range = "B2:I7")
test  = read_excel(path, range = "K2:M21")

result = input %>%
  pivot_longer(cols = -c(1, 2), names_to = "Appointments", values_to = "value") %>%
  na.omit() %>%
  uncount(value)

all.equal(result, test, check.attributes = FALSE)
# [1] TRUECrispo - Excel Challenge 05 2025
excel-challenges
weekly-exercises
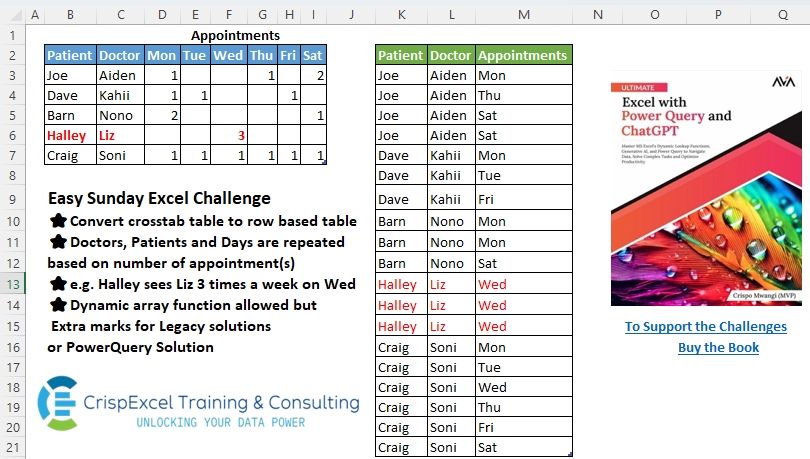
Easy Sunday Excel Challenge
Challenge Description
Easy Sunday Excel Challenge
⭐Convert crosstab table to row-based table. ⭐Doctors, Patients and Days are repeated based on the number of appointment(s). ⭐e.g. Halley sees Liz 3 times a week on Wed.
Solutions
Logic:
- Pivot the Crosstab Table Use
pivot_longer()to transform column names (appointment days) into a single “Appointments” column.
Remove Missing Values Use
na.omit()to filter out empty appointment entries.Expand Rows Based on Appointment Count Use
uncount(value)to repeat rows based on the count of appointments.
- Pivot the Crosstab Table Use
Strengths:
- Compact and Readable: Uses
tidyversefunctions for a clear and structured pipeline.
Efficient Row Expansion:
uncount(value)dynamically expands rows based on appointment counts.Handles Missing Values Automatically:
na.omit()ensures only meaningful data is retained.
- Compact and Readable: Uses
Areas for Improvement:
- Formatting: Consider checking for duplicate separators (e.g., extra spaces or semicolons).
- Scalability: If demand values are floating-point numbers instead of integers, precision issues might arise.
Gem:
uncount(value)is a powerful function that simplifies row expansion, making the transformation seamless.
import pandas as pd

path = "files/Ex-Challenge 05 2025.xlsx"
input = pd.read_excel(path, usecols="B:I", skiprows=1, nrows=5)
test = pd.read_excel(path, usecols="K:M", skiprows=1, nrows=20)\
    .rename(columns=lambda x: x.replace('.1', ''))\
    .sort_values(by=['Patient', 'Appointments']).reset_index(drop=True)

input_piv = input.melt(id_vars=input.columns[:2], var_name="Appointments", value_name="value")
input_piv = input_piv.dropna()
input_piv = input_piv[input_piv['value'] >= 0]
input_piv = input_piv.loc[input_piv.index.repeat(input_piv['value'])].reset_index(drop=True)
input_piv = input_piv.drop(columns=['value'])
input_piv = input_piv.sort_values(by=['Patient', 'Appointments']).reset_index(drop=True)

print(input_piv.equals(test)) # TrueLogic:
- Pivot the Crosstab Table Use
.melt()to move column names (appointment days) into a single column.
Remove Missing Values Use
.dropna()to filter out empty appointment entries.Expand Rows Based on Appointment Count Use
.ld[input_piv.index.repeat(input_piv['value'])]to repeat rows based on appointment count.Sort for Consistency Use
.sort_values()to match expected output.
- Pivot the Crosstab Table Use
Strengths:
- Efficient Ranking: Uses
rank(method='dense', ascending=False).astype(int)to ensure consecutive ranking without gaps.2 - Concatenation of Fruits: Uses
.groupby('Rank')['Fruit'].agg(' ; '.join)to merge fruit names within the same rank. - Concise and Vectorized: Uses
assignfor ranking andgroupbyfor aggregation, ensuring efficient execution.
- Efficient Ranking: Uses
Areas for Impqrovement:
Optimize Row Expansion:
.repeat(value)can be memory-intensive if the appointment count is high.Handle Edge Cases for Zeros Explicitly: Filtering out non-positive values (
>= 0) ensures no errors, but a more explicit check would be better.
Gem
.repeat(value)is a clean and efficient way to expand rows dynamically, avoiding complex loops.
Difficulty Level
This task is moderate:
- Requires Data Reshaping: Uses
.melt()in Python andpivot_longer()in R to convert wide data into a long format.
Row Expansion is Non-Trivial: Needs
.repeat(value)in Python anduncount(value)in R to generate repeated rows dynamically.Handles Missing Values Dynamically: Ensuring missing or empty values do not affect the transformation adds complexity.